You finished a busy week. Five services, two timing belts, a clutch, and a constant stream of smaller jobs. The ramps were full every day, the lads didn’t stop, and you turned away work on Wednesday because you simply didn’t have the space.
Then you look at the bank account on Friday evening. And the number is nothing like what the week felt like.
This is one of the most common — and most demoralising — experiences in garage ownership. Busy isn’t the same as profitable. And until you understand what your margins actually should look like, it’s almost impossible to know where the money is going.
This post lays out realistic benchmarks for Irish independent garages: what healthy margins look like for parts, labour, and the business overall, where most workshops leak profit without realising it, and what you can do to close the gap.
The two numbers every garage owner should know
Before we get into benchmarks, it’s worth being precise about what “profit margin” actually means in a garage context. Most conversations conflate two very different figures.
Gross profit margin is the money left after you subtract the direct cost of doing the work — parts and labour — from your revenue. It tells you how efficiently you’re turning jobs into gross profit before your fixed costs (rent, insurance, utilities, equipment) come out.
Net profit margin is what remains after everything — all operating costs, owner drawings, taxes — is accounted for. This is the real number. It tells you whether the business is actually creating wealth or just generating activity.
A busy garage with a poor gross margin will almost always have a terrible net margin, because there isn’t enough left over to cover the fixed costs. That’s the pattern behind the “busy but broke” experience.
Benchmark: gross profit margin
For an independent Irish garage, a healthy gross profit margin is broadly 50 to 60%.
That means for every €100 you invoice, €50 to €60 remains after the direct cost of parts and labour is subtracted. The other €40 to €50 goes toward covering your fixed costs and, if you’re doing well, generating net profit.
Below 45% is a signal that something structural isn’t working — your parts markup is too low, your labour rate isn’t covering your real costs, or a combination of both. Above 60% is achievable in well-run specialised shops but is difficult to sustain in general repair across a high-volume throughput.
Most independent garages, if they’re honest about their numbers, sit somewhere in the 45 to 55% range. Getting to the upper end of that range — or above it — is where the meaningful financial difference is made.
Benchmark: parts markup
Parts markup is where there is the most confusion, and the most money left on the table.
Let’s be clear on terminology first. Markup is calculated on cost. Margin is calculated on the selling price. They are not interchangeable, and mixing them up is a common source of undercharging.
If a part costs you €100 and you apply a 50% markup, you sell it for €150. Your margin on that sale is 33% (€50 / €150). If you’re aiming for a 50% margin, you need to charge €200 — which is a 100% markup on cost.
This confusion alone — applying margin percentages as markups — is responsible for significant undercharging in many workshops.
What the benchmarks say
For independent garages, a reasonable parts markup ranges from 40% to 80% on cost, depending on the part type, the job, and your supplier pricing. That translates to a parts gross margin of roughly 30% to 45%.
A useful way to think about it by category:
| Part type | Typical markup on cost | Typical gross margin |
|---|---|---|
| Consumables (filters, belts, bulbs) | 60–100% | 38–50% |
| Common service parts (pads, discs, plugs) | 40–60% | 29–38% |
| Major components (clutch kits, alternators) | 25–45% | 20–31% |
| Tyres | 15–30% | 13–23% |
Tyres typically carry the thinnest margins because customers price-check them online. Major components are harder to mark up because customers increasingly know what they cost. Consumables and common service parts are where you have the most room — and where many garages leave money.
The target overall, blended across all parts, is a gross margin of around 35 to 45%. If your parts margin is consistently below 30%, you either have a supplier pricing issue, a markup policy that’s too conservative, or both.
The supplier deal trap
One thing that skews parts margins downward is buying on account credit without tracking what you’re actually paying per item. You know your end-of-month statement figure. But do you know whether your cost per brake pad has crept up 12% over two years while your selling price has stayed the same?
Most garages don’t — because nobody’s comparing cost price at invoice time against what’s being charged to the customer. Purchase orders linked to jobs solve this: every part ordered has a cost captured at the time of ordering, which flows automatically into the job margin calculation. You can see at job level whether your parts margin is holding up — before the month is over and the damage is done.
Benchmark: labour gross profit
Labour is where the largest margin opportunity sits — and where the largest losses usually occur.
Labour gross profit is calculated by comparing what you charge for labour against the actual technician cost of completing the work (wages, employer PRSI, and a portion of overhead attributable to the bay time used).
For a well-run independent garage, labour gross profit should be in the range of 55 to 70%.
That sounds high. Here’s why it’s realistic.
If your technician earns €18 per hour and you charge €85 per hour, the gross labour margin on a one-hour job is ((€85 - €18) / €85) = 79%. But that €18 doesn’t capture the full cost — employer PRSI, paid holidays, sick leave, and the reality that no technician is billable for 100% of their time. Factor those in and the effective cost per productive hour rises to somewhere in the €28–38 range, bringing your realistic labour gross margin down to 55–65% at an €85 rate.
What should your hourly rate be?
Irish independent garages were typically charging in the range of €75 to €100 per hour in 2024, depending on location, specialisation, and market positioning. Dublin and larger urban areas tend to sit at the higher end. Rural and smaller-town garages often sit in the €70–85 range.
The mistake most garages make is setting their labour rate by looking at competitors rather than by calculating what rate they need to cover costs and generate profit. Competitor rates are useful context. They shouldn’t be the primary input.
To find your minimum viable labour rate, you need to know:
- Total fixed costs per month (rent, insurance, equipment finance, utilities)
- Total technician costs per month (wages, PRSI, holiday cover)
- Realistic billable hours per month per technician (typically 120–140 in a well-run garage, not the theoretical maximum)
Divide total costs by total billable hours and add your target net profit margin. The number you get is what you need to charge — not what your nearest competitor charges. Our post on how to set labour rates for your garage walks through this calculation in detail.
Benchmark: net profit margin
After all costs, a sustainable independent garage should be generating a net profit margin of 8 to 15%.
That’s the number that matters most for the long-term health of the business. It’s what you reinvest in equipment, what creates resilience in a slow month, and what your business is ultimately worth to a buyer.
Below 5% and you’re essentially working for wages with all the risk of business ownership and none of the reward. Below 0% and you’re funding the business from your own drawings or credit, which is not a sustainable position.
Many garages that feel profitable are actually running on 3-6% net margins — busy, solvent, but not building real financial value. The garages that consistently hit 10%+ tend to share a few characteristics: they know their numbers in real time, they manage parts margins actively, their labour rates are set on cost rather than competition, and they track job-level profitability rather than just monthly totals.
Where most Irish garages leak profit
Understanding the benchmarks is one thing. Knowing where the gap between your numbers and the benchmarks comes from is what lets you do something about it.
These are the most common profit leaks in independent Irish workshops.
Parts not making it onto the job card
You order a water pump for a specific job. It arrives, gets fitted, and the job is invoiced. But the parts cost wasn’t added to the job card — or it was added manually at a different price than you actually paid. The margin calculation is wrong from the start.
This is more common than most garage owners realise, particularly in busy periods when the process gets rushed. The only reliable fix is a workflow where parts ordering and job costing are connected — not two separate steps done at different times by different people.
Labour time not captured accurately
Quoting two hours and the job taking three is an invisible loss. If the invoice goes out for two hours, you’ve funded an hour of work. If it happens on ten jobs a month, that’s a significant monthly undercharge.
Time capture — whether that’s a formal clocking system or simply a discipline around updating job cards — is the foundation of accurate labour billing.
The diagnostic charge gap
Diagnosis is skilled, time-consuming work. Many garages either don’t charge for it separately, or charge a nominal amount that doesn’t reflect the time involved. A complex diagnostic job that takes 90 minutes to correctly identify and then leads to a relatively simple repair can easily lose money if the diagnostic time isn’t charged properly.
Diagnostic charges are legitimate, and customers who understand the value of accurate diagnosis — especially on modern vehicles — will generally accept them. The ones who won’t were probably not going to authorise the repair anyway.
Warranty and comeback work
Warranty work is a necessary part of running a reputable garage. But if it happens frequently, it’s a direct margin drain — technician time spent on work you’re not billing for. Tracking comeback frequency per technician and per job type lets you identify whether there’s a pattern worth addressing.
Pricing inertia
Labour rates and parts markups set three years ago may not reflect what your costs look like today. Technician wages have increased. Parts costs have increased. Energy costs have increased. If your pricing hasn’t kept pace, your margins are being slowly compressed every year without any single event you can point to.
Reviewing your rates annually — against your actual cost base, not against competitors — is basic financial hygiene that many garages skip.
How to measure your own margins
Most garage owners know their revenue because it’s on the invoices. Fewer know their gross margin because that requires knowing the cost of every job — not just at month-end from the accountant’s summary, but in real time, at job level.
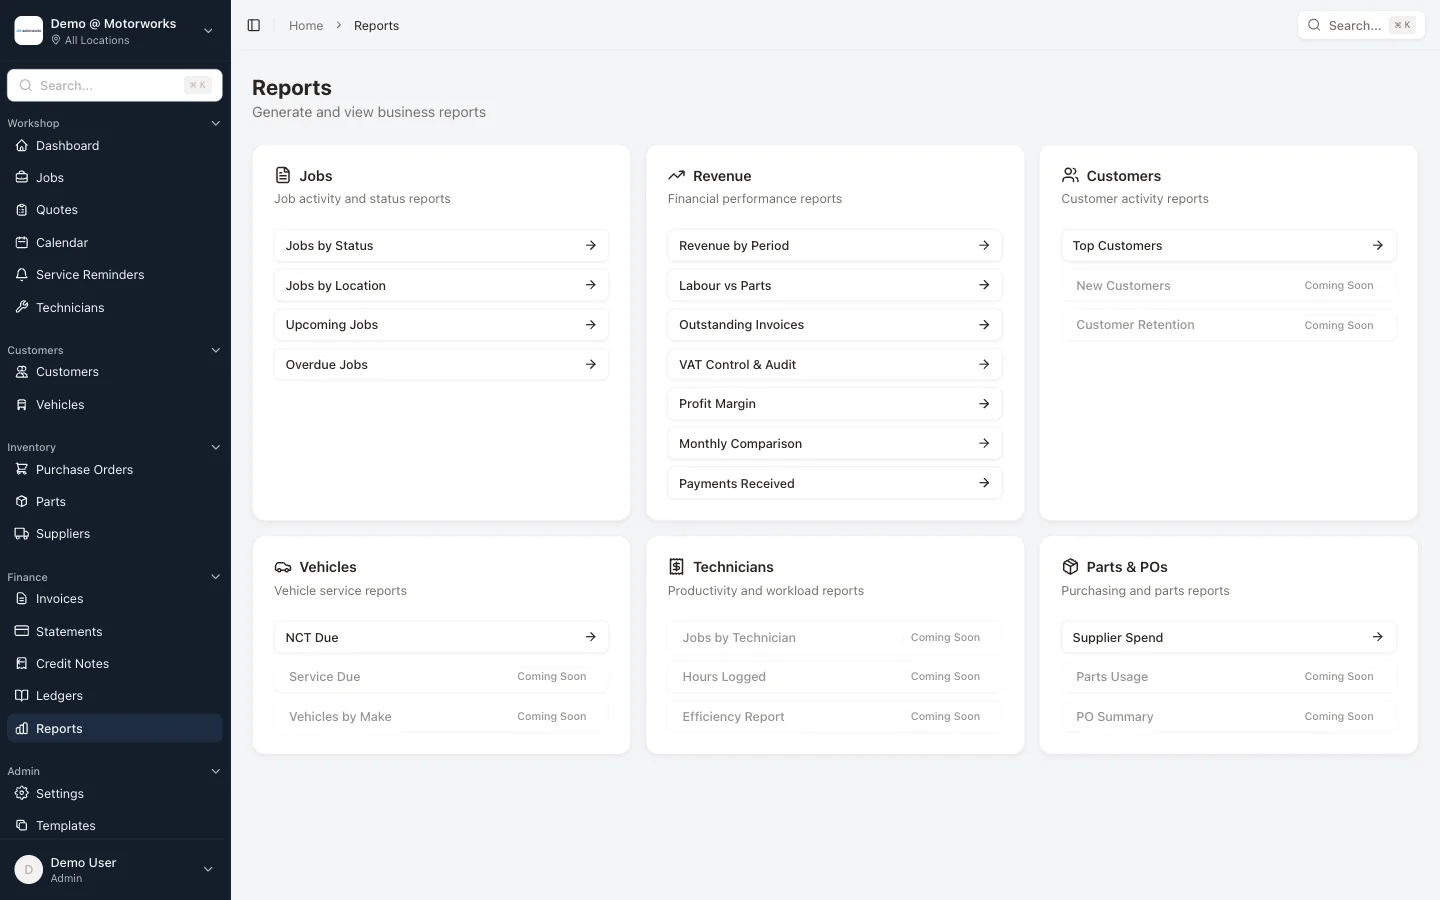
The most useful financial view in a garage isn’t your monthly P&L. It’s job-level profitability: what each job generated in gross margin, broken down by parts and labour. That’s the view that tells you which job types are worth doing and which are quietly losing you money.
Profitability reports built for garages give you this. You can see average margins by service type, by technician, and by time period — so you can spot whether your oil services are margin-positive or margin-negative, whether one technician’s jobs consistently come in under target, and whether your parts margins have drifted over the past quarter.
This kind of visibility is what separates garages that hit the upper end of the benchmark ranges from those that hit the lower end. It’s not that the better-performing garages are doing fundamentally different work. They just know what’s happening financially in real time, rather than finding out six weeks after the fact from an accountant’s summary.
Connecting your financial picture
Profit margins don’t improve in isolation. The parts margin connects to how you manage purchase orders and supplier costs. The labour margin connects to how accurately you track time and how correctly your labour rate is set. The net margin connects to your ability to invoice efficiently and manage cash flow.
The garages that pull these threads together — where every part ordered links to a job, every hour worked is captured, every invoice is generated from the job card rather than reconstructed separately — are the ones that can actually see and manage their margins, rather than guessing.
If you want a broader picture of the financial tools Irish garages use to manage this, the post on garage accounting software for Irish workshops covers the invoicing, purchase order, and reporting side in more detail.
A realistic benchmark summary
To put the key numbers in one place:
- Overall gross profit margin: 50–60% (below 45% needs attention)
- Parts gross margin: 35–45% (blended across all part types)
- Labour gross margin: 55–70% (dependent on rate and productive utilisation)
- Net profit margin: 8–15% (below 5% is not sustainable long-term)
- Hourly labour rate (Ireland): €75–100, set on cost not on competition
These aren’t aspirational figures from a management consultant’s presentation. They’re achievable numbers for a well-run independent garage in Ireland — and many garages are hitting them. If yours aren’t, the gap usually comes down to a small number of identifiable causes: underpriced labour, parts margins that have drifted, or work that’s done but not fully billed.
Finding the leak is the first step. Fixing it is mostly a matter of process.
If you want to see what job-level profitability tracking looks like in practice, book a demo and we’ll show you how MotorWorks surfaces the margin data that lets you run a genuinely profitable workshop — not just a busy one.
Frequently asked questions
What is a good gross profit margin for a garage? For an independent Irish garage, a healthy gross profit margin is 50 to 60%. Below 45% usually indicates underpriced labour, insufficient parts markup, or both.
What markup should a garage put on parts? A reasonable markup ranges from 40 to 80% on cost depending on the part type, giving a gross margin of 35 to 45% blended across all parts. Consumables and common service parts typically carry the highest markups; tyres and major components carry the least.
What should an Irish garage charge per hour for labour? Most independent Irish garages charged €75 to €100 per hour in 2024. The right rate for your garage should be based on your actual costs and target profit, not on what your local competitors charge.
What net profit margin should a garage aim for? A sustainable independent garage should target 8 to 15% net profit margin. Below 5% means the business is not generating real financial value relative to the risk and effort involved.
Why do busy garages sometimes make little profit? The most common causes are: parts not fully billed onto job cards, labour time not accurately captured, a labour rate set below the true cost of doing work, and pricing that hasn’t kept up with rising costs. High revenue and thin margins often co-exist because the volume masks the margin problem.