You’ve probably been told you need to track everything. Customer satisfaction scores. Average repair order times. Parts-to-labour ratios. Technician comebacks. Booking conversion rates. The list goes on.
And maybe you’ve tried. You opened a spreadsheet, pulled some numbers, looked at them for ten minutes, and then went back to running your garage. Because what do you actually do with fifty metrics? Where do you even start?
Here’s the truth: most garage owners don’t need a complex dashboard. They need five numbers. If those five are healthy, your business is healthy. If one of them is off, you know exactly where to look.
These are the five.
1. Revenue Per Bay (Monthly)
What it measures
How much money each of your ramps or bays is generating every month. If you have four bays and you made €40,000 in revenue last month, your revenue per bay is €10,000.
It sounds simple, and it is. But it’s the most direct measure of whether your workshop space is being used effectively. A bay that sits empty generates nothing. A bay running at capacity all day generates everything.
What good looks like
For a well-run independent garage in Ireland, a productive bay should be generating somewhere in the region of €8,000 to €14,000 per month, depending on your service mix and pricing. Garages doing specialist work or running longer hours at the higher end. General service and repair at the lower.
If you’re below €6,000 per bay consistently, something is wrong — either with your utilisation, your pricing, or both.
What to do if it’s low
First, work out which part of the equation is the problem. Are your bays actually empty during working hours? Or are they busy but not generating revenue? Those are two different problems.
If the bays are empty: You have a scheduling or demand problem. Look at your booking patterns. Are there days or times when work consistently dries up? Are you filling your diary as far in advance as you should be?
If the bays are busy but revenue is low: Your pricing or job mix is the issue. You might be doing too many low-value jobs, undercharging on labour, or losing margin on parts. This leads naturally into the next number.
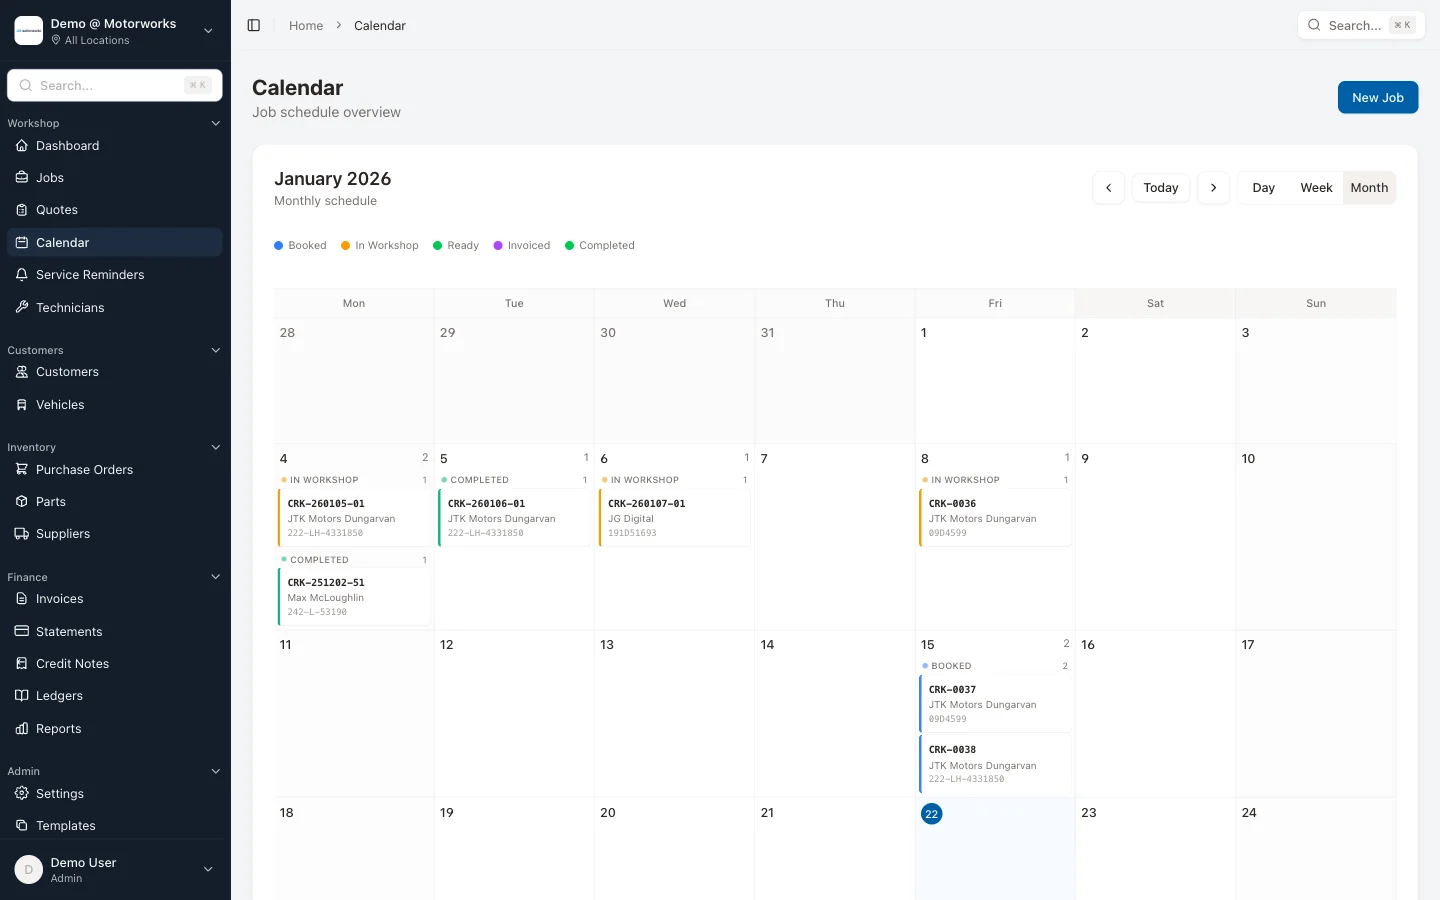
Your reporting dashboard should be able to show you revenue by ramp over any period you choose — MotorWorks includes 15+ built-in reports covering exactly this. If you’re currently calculating this manually, that’s the first thing to fix.
2. Average Job Value
What it measures
Total revenue divided by total number of jobs, over whatever period you’re looking at. If you completed 120 jobs last month and invoiced €30,000, your average job value is €250.
This number tells you a lot. It tells you whether you’re attracting the right work. It tells you whether your quoting is realistic. And when it changes, it tells you something has shifted — in your customer base, your service mix, or your pricing.
What good looks like
There’s no universal answer because it depends heavily on what your garage does. A workshop focused on NCT preparation and minor servicing will have a lower average job value than one doing clutch replacements, gearbox work, and major repairs.
What matters is tracking your own average over time and understanding the trend. Is it going up, down, or flat? And why?
As a rough benchmark: if your average job value is under €150 and you’re doing general automotive work, you’re probably doing too many small jobs relative to your capacity. If it’s above €600, check that your larger jobs are actually profitable and not subsidising your smaller ones.
What to do if it’s low
A low average job value usually has one of three causes:
- Too many small jobs: You’re filling your days with oil changes and bulb replacements while turning away more complex work, or not attracting it in the first place.
- Underquoting: You’re getting the work but not charging what it’s worth. Labour rates that haven’t kept pace with costs are the most common culprit here.
- Incomplete job capture: You’re doing more than you’re charging for. Parts that don’t make it onto the job card. Diagnostic time that isn’t billed. Extra work done as a favour that slowly adds up.
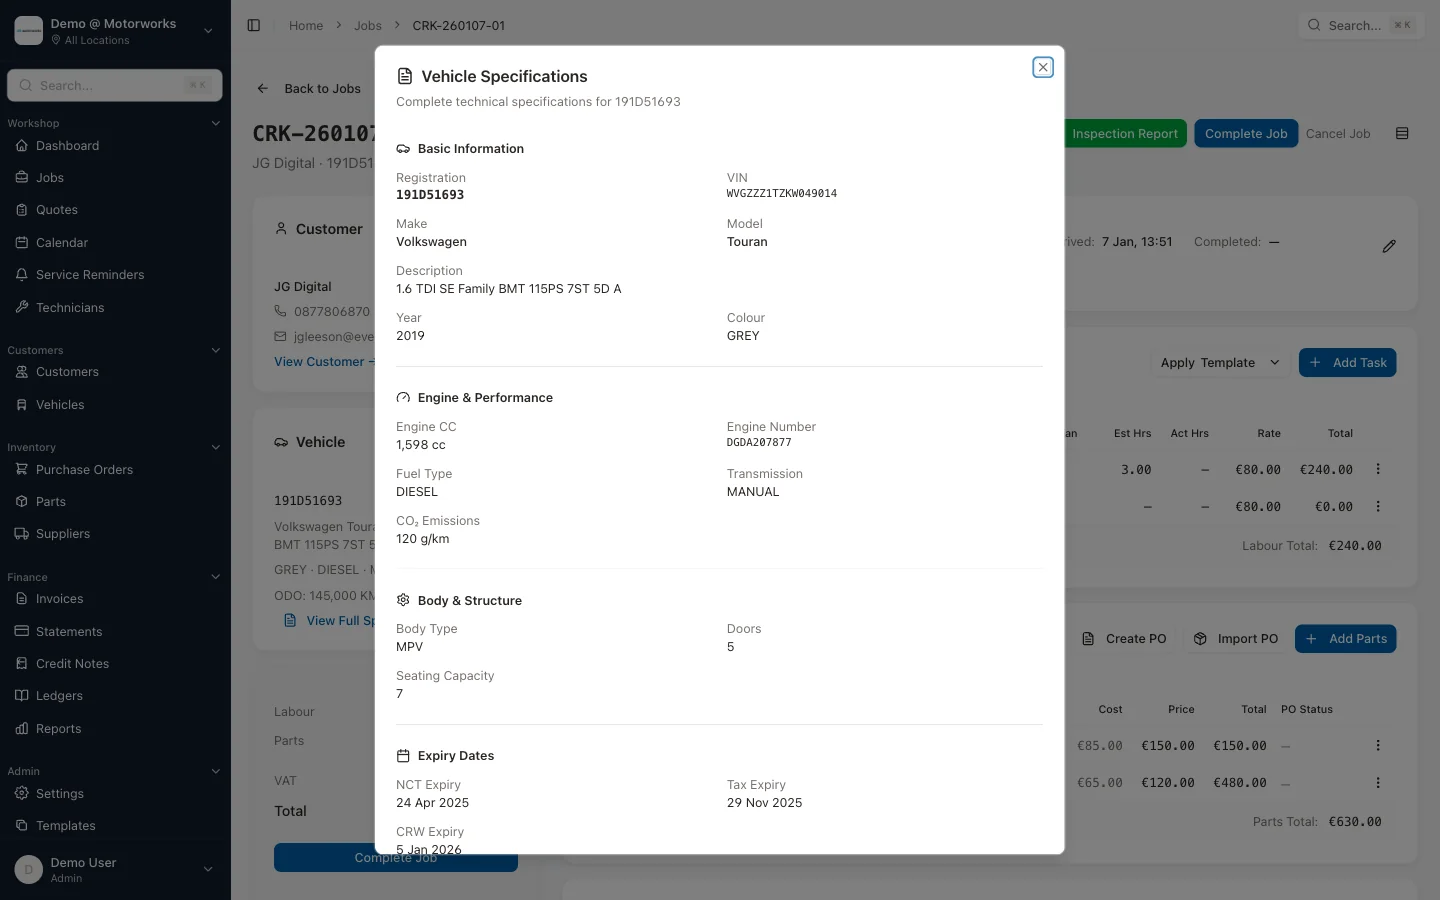
The fix for incomplete job capture is largely a job management and process issue. When everything flows through one system — parts ordering via purchase orders, labour logging, invoicing — it becomes much harder to accidentally undercharge. Purchase orders linked to jobs also give you real margin visibility: you can see exactly what you spent on parts versus what you charged, per job.
3. Technician Utilisation Rate
What it measures
The percentage of a technician’s available hours that are actually billed out to customers. If a technician works 40 hours in a week and you bill 32 of those hours to jobs, their utilisation rate is 80%.
This is one of the most important numbers in any workshop, and one of the least commonly tracked. Labour is your biggest cost. Whether or not that labour generates revenue determines whether your garage makes money.
What good looks like
An experienced technician in a well-run workshop should be hitting 75-85% billable utilisation. Higher than 90% is difficult to sustain over time — it usually means cutting corners or burning people out. Below 65% consistently means something is going wrong.
Important caveat: utilisation should be measured against your own standard labour rate, not against optimistic flat-rate targets. The goal is accuracy, not flattering numbers that don’t reflect reality.
What to do if it’s low
Low utilisation has several possible causes, and they require different responses:
Scheduling gaps: Work isn’t flowing into the workshop smoothly. Too many gaps between jobs, too much time spent waiting for parts. This is a workflow and booking issue.
Non-productive time: Technicians are spending significant time on things that aren’t billable — admin, waiting for authorisation, chasing parts, repeat work on comebacks. Some of this is unavoidable, but it should be minimised.
Skill mismatch: Your most experienced (and expensive) technicians are doing work that could be handled by a less senior person, while complex work sits waiting. This is a scheduling and allocation problem.
Comeback work: Jobs coming back because they weren’t done right first time. This isn’t just a quality issue — it’s a utilisation issue, because comeback work consumes hours that aren’t billable.
Tracking utilisation properly requires a system that records actual time spent on jobs, not just estimated time. If your technicians aren’t logging time against jobs, you’re guessing — and garages that guess about utilisation tend to find out the hard way that it was worse than they thought. MotorWorks tracks time logged per technician per job, and the profitability reports show you utilisation, revenue per technician, and productivity trends over time.
For a deeper look at how labour rates interact with utilisation to determine whether your garage actually makes money on labour, see the guide on setting labour rates.
4. Customer Return Rate
What it measures
The percentage of customers who come back to you within a defined period. There are different ways to calculate this, but a simple version: of all the customers who visited you in the past 12 months, what percentage had also visited you in the 12 months before that?
This is your loyalty metric. It tells you whether you’re building a customer base or just processing one-time jobs.
What good looks like
For a general service and repair garage with a healthy customer base, a 12-month return rate of 55-70% is solid. Higher if you’re in a location with limited competition or a strong local reputation. Lower rates — particularly under 40% — suggest you’re spending too much effort acquiring customers you then lose.
It’s worth thinking about this from the customer’s perspective. A typical car owner might need their vehicle serviced once or twice a year, plus the odd repair. If your return rate is low, most of your customers are going somewhere else for that second visit — or they only came to you once and didn’t come back at all.
What to do if it’s low
A low return rate is usually a symptom of one of three things:
Service experience problems: Customers left unhappy, uncertain, or feeling like they were overcharged. They don’t come back because they don’t want to.
Lack of follow-up: Customers were perfectly happy but simply forgot about you. Nobody reminded them when their service was due, no one followed up after a repair. Out of sight, out of mind. We covered this in detail in our post on garage accounting and customer retention.
No retention system: You have no way of knowing which customers haven’t been back, and no process for reaching out to them. If you can’t see who’s drifted, you can’t do anything about it.
Service reminders are the single most effective tool here. A simple text or email when a customer’s service is due — timed automatically based on when they last came in — costs almost nothing to send and consistently brings people back. If you’re not doing this, you’re relying entirely on customers remembering to come back on their own. Most won’t.
We wrote a full guide on customer retention for garages that covers what drives repeat business and how to systematically prevent customer drift.
5. Aged Debt
What it measures
The total amount owed to your garage by customers and fleet accounts, broken down by how long it’s been outstanding. Typically shown in buckets: 0-30 days, 31-60 days, 61-90 days, and over 90 days.
Aged debt isn’t just a cash flow number — it’s a measure of financial health and operational discipline. How much are you owed? Who owes it? And how long have they been sitting on it?
What good looks like
A healthy garage should have very little aged debt over 60 days. If you’re predominantly retail (individual customers paying at point of collection), almost all your debt should sit in the 0-30 day bucket, and the total should be small relative to your monthly turnover.
Fleet and trade accounts naturally carry more credit, and a 30-day credit term is normal. But if you have fleet accounts regularly slipping to 60 or 90 days, you have a problem — both for cash flow and for the relationship.
The overall rule: aged debt over 90 days that you haven’t actively pursued is money you’re probably not going to collect. It might already be gone.
What to do if it’s rising
Rising aged debt is almost always a process problem rather than a customer problem.
No clear terms: If customers don’t know when payment is due, they won’t prioritise it. Invoice terms should be explicit and consistent.
No systematic chasing: Sending one invoice and hoping for the best isn’t a credit control process. Regular statements, automatic overdue reminders, and a clear escalation path (phone call, letter, solicitor) make a measurable difference.
Letting it slide with good customers: This is the most common issue. You don’t want to upset a valuable fleet account, so you let the invoice sit. Months pass. Now you’re owed €3,000 and the conversation is genuinely awkward. Early, professional chasing is always better than late, desperate chasing.
Your invoicing system should show you aged debt at a glance, without you needing to build a spreadsheet to work it out. MotorWorks includes receivables aging reports, and statements and credit notes can be generated and sent directly from the system. Automated statements sent monthly to everyone with an outstanding balance — that single thing prevents most aged debt from getting out of hand.
For more on managing cash flow and chasing payments effectively, see the guide on stopping the payment chase.
Putting it together
These five numbers — revenue per bay, average job value, technician utilisation, customer return rate, and aged debt — give you a complete picture of your garage’s financial health. Not a dashboard with fifty metrics. Five.
Check them monthly. Know what your baselines are. When something moves in the wrong direction, investigate why before it becomes a problem.
The garages that do this consistently make better decisions. They know when to hire, when to raise prices, when to chase debt, and when to start worrying. The garages that don’t track them find out something’s wrong when it’s already too late to fix it easily.
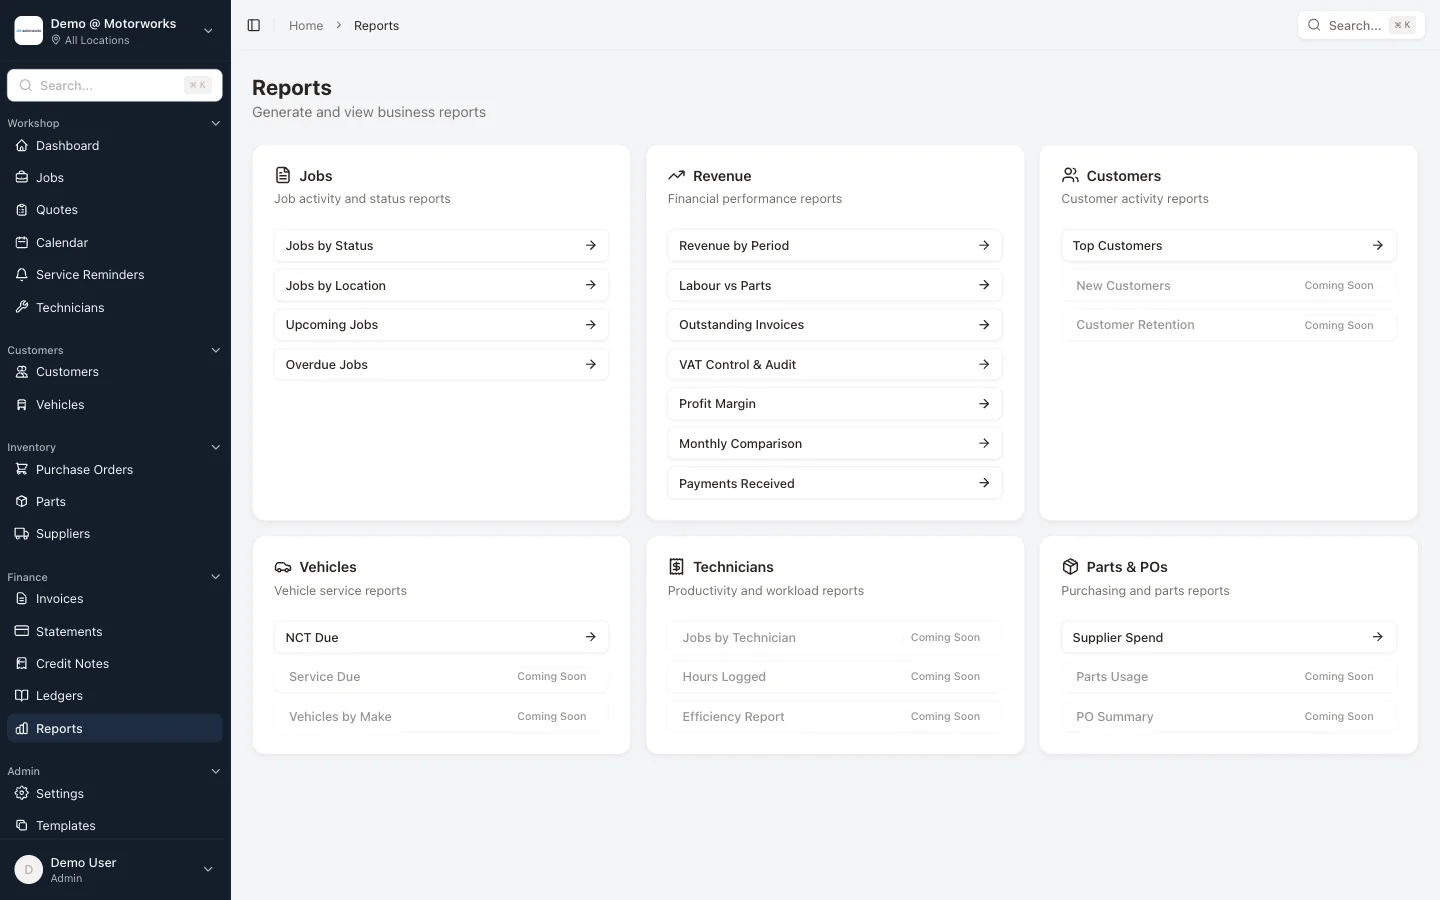
If you don’t currently have a clear view of all five of these in one place, that’s the starting point. Your garage reports should give you this without a spreadsheet in sight. For a broader look at profitability benchmarks and where Irish garages typically sit, see the post on garage profit margins and benchmarks.
Want to see what your garage’s numbers actually look like? MotorWorks tracks all five of these — revenue by bay, job value trends, technician utilisation, customer return rates, and aged debt — in one dashboard built specifically for Irish workshops. Book a demo and we’ll show you what the reporting looks like on a real account.